Background
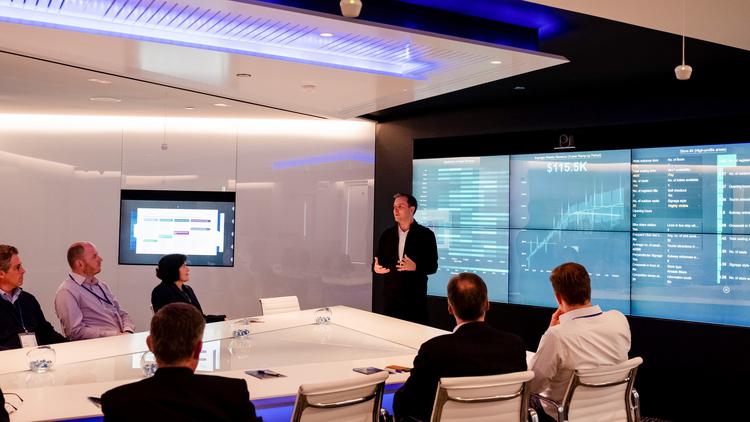
KPMG Ignition has 11 state-of-the-art collaboration spaces across the world.
These centers host workshops and sessions focused on bringing our data & analytics, AI, NLP, and ML solutions to life for their top clients.
These are presented on large interactive touchscreens, powered by MT Canvus.
I led all the creation of this content, from intake, storytelling, and creative design, to managing our in-house and off-shore development teams.
Due to the pandemic, we needed to pivot and create this content so it could be presented virtually, via the web.
Objective
Lead the creation of interactive experiences that help bring KPMG data & analytics solutions to market.
With a focus on facilitating collaboration and stimulating creativity, the Insights Center provides a unique environment for KPMG and our clients to work together to tackle our clients’ issues through data & analytics (D&A).
Solution
Create responsive web experiences that visually explain complex data & analytics solutions through animated processes, data visualizations, and interactive simulations.
Technically, leverage html/css/javascript and render on tablets, laptops (1920×1080), and inside the Insights Centers (5760 x 3240).
Team
As Creative Director and lead designer, I lead a 7 person team consisting of:
- 1 Project manager
- 4 Developers
- 2 QA testers
This is a quote
Blah blah
Discovery
At the start of each project, we ask stakeholders (Partners and Managing Directors) to fill out an intake form.
Based on their responses, we assess to see if it fits within a field of play and meets our business objectives.
If yes, we begin by having a discovery session and asking hard questions to establish the story arc.
Key interview questions:
- What makes this solution special?
- How is it different than our competitors’ solutions?
- What value does it bring the end-user?
- What technologies are leveraged?
- Why KPMG?
- etc.
From this session, a story outline is created and reviewed, using Confluence as our collaboration platform.
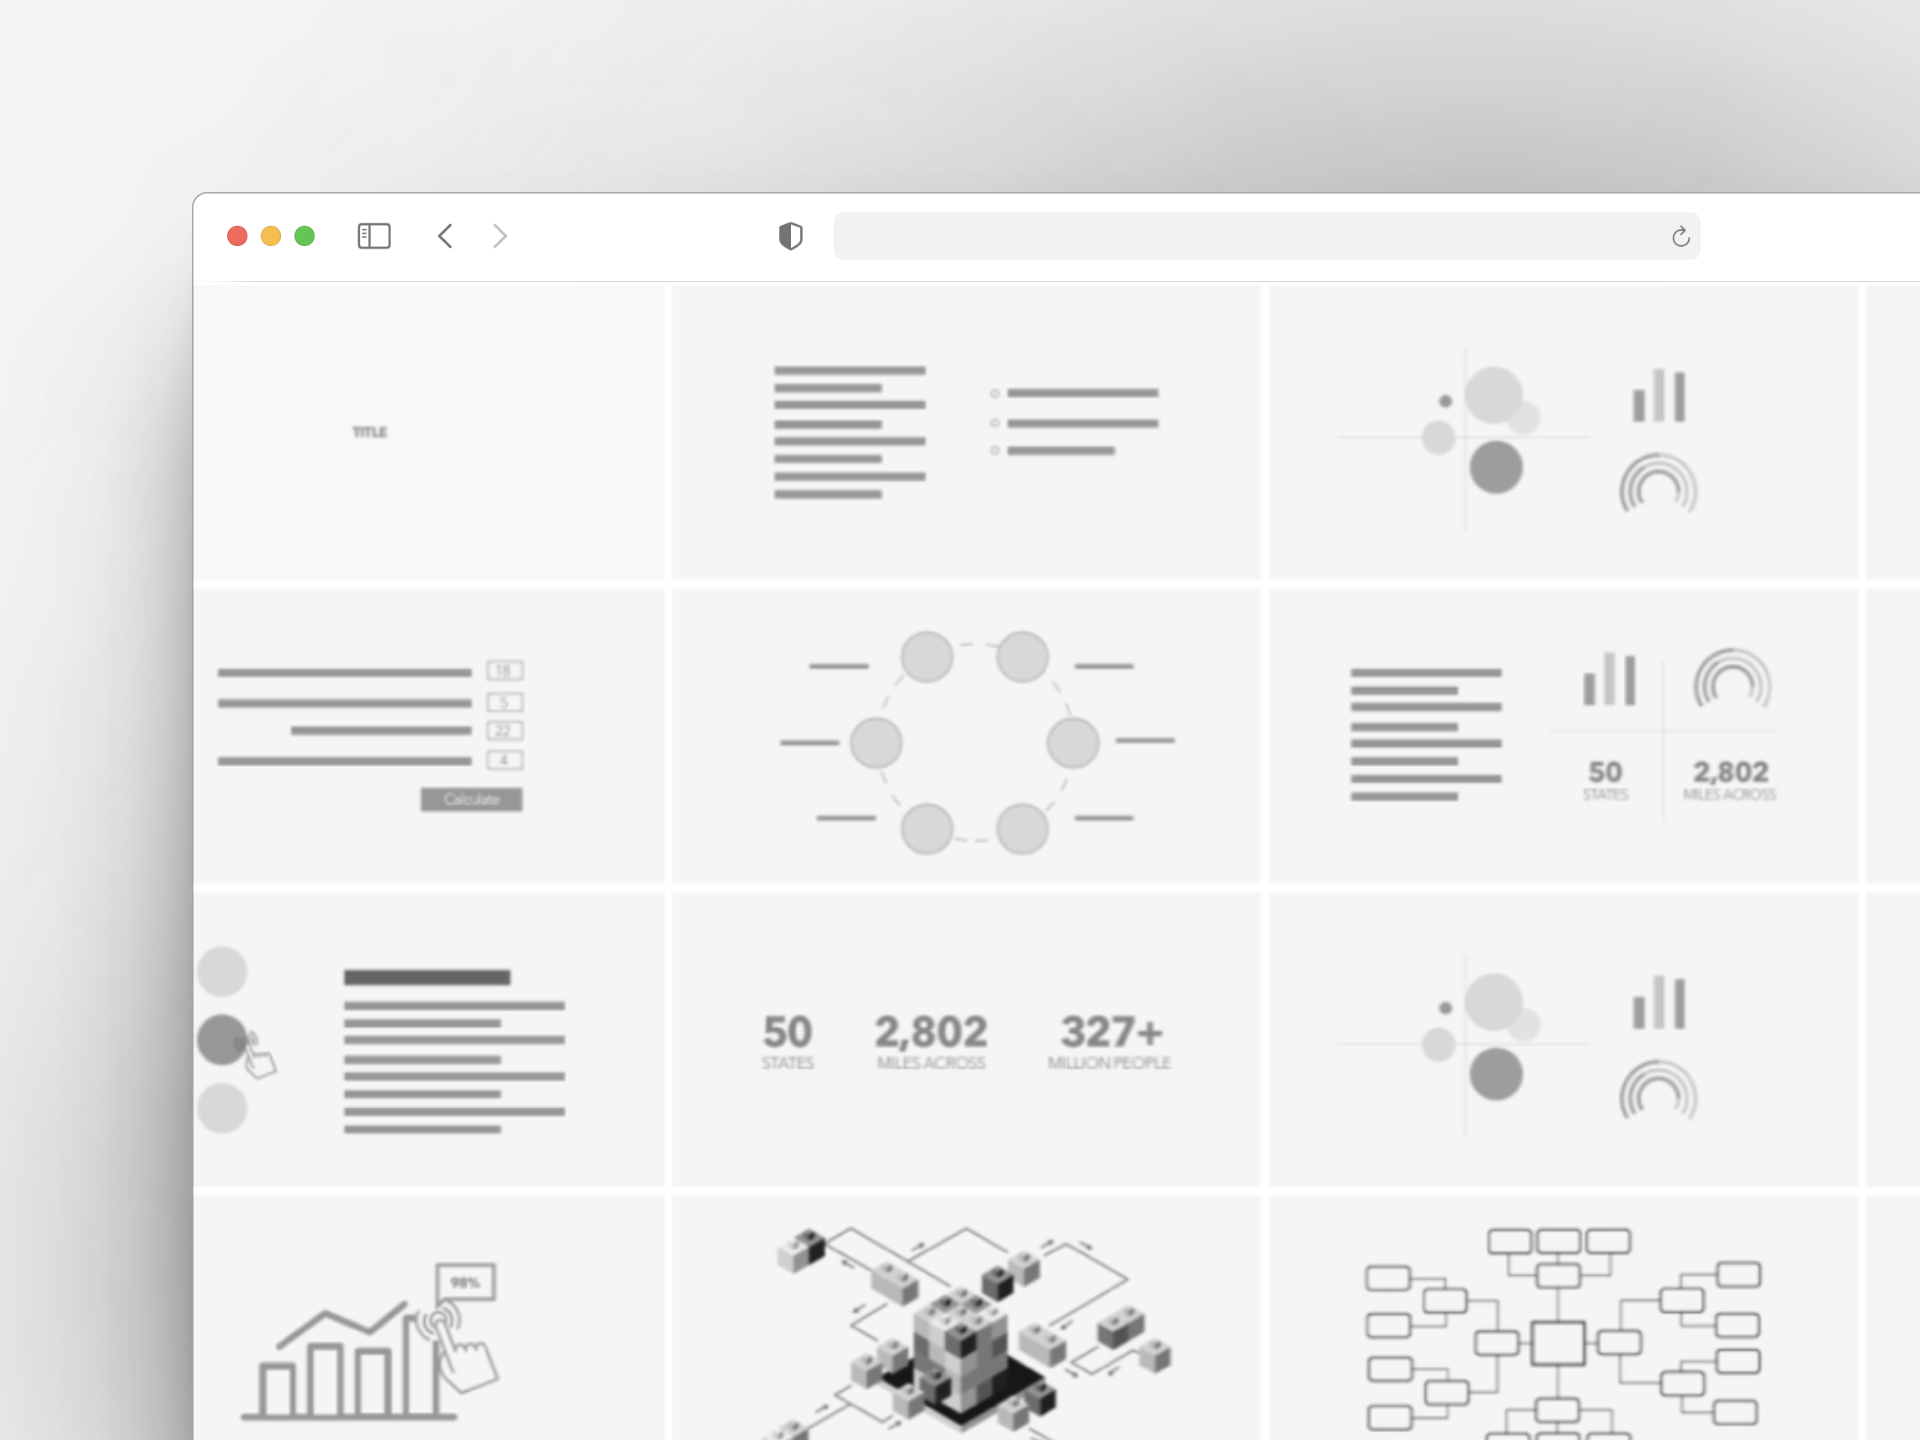
User flows
Using a set of pre-designed story tiles, we collaborate on the visual story.
Like wireframes, we separate our design and focus on the overall flow of the story.
This allows us to quickly iterate and come up with a solid story arc, without focusing on visual presentation.
Once approved, we start working on the visuals and the presentation script.
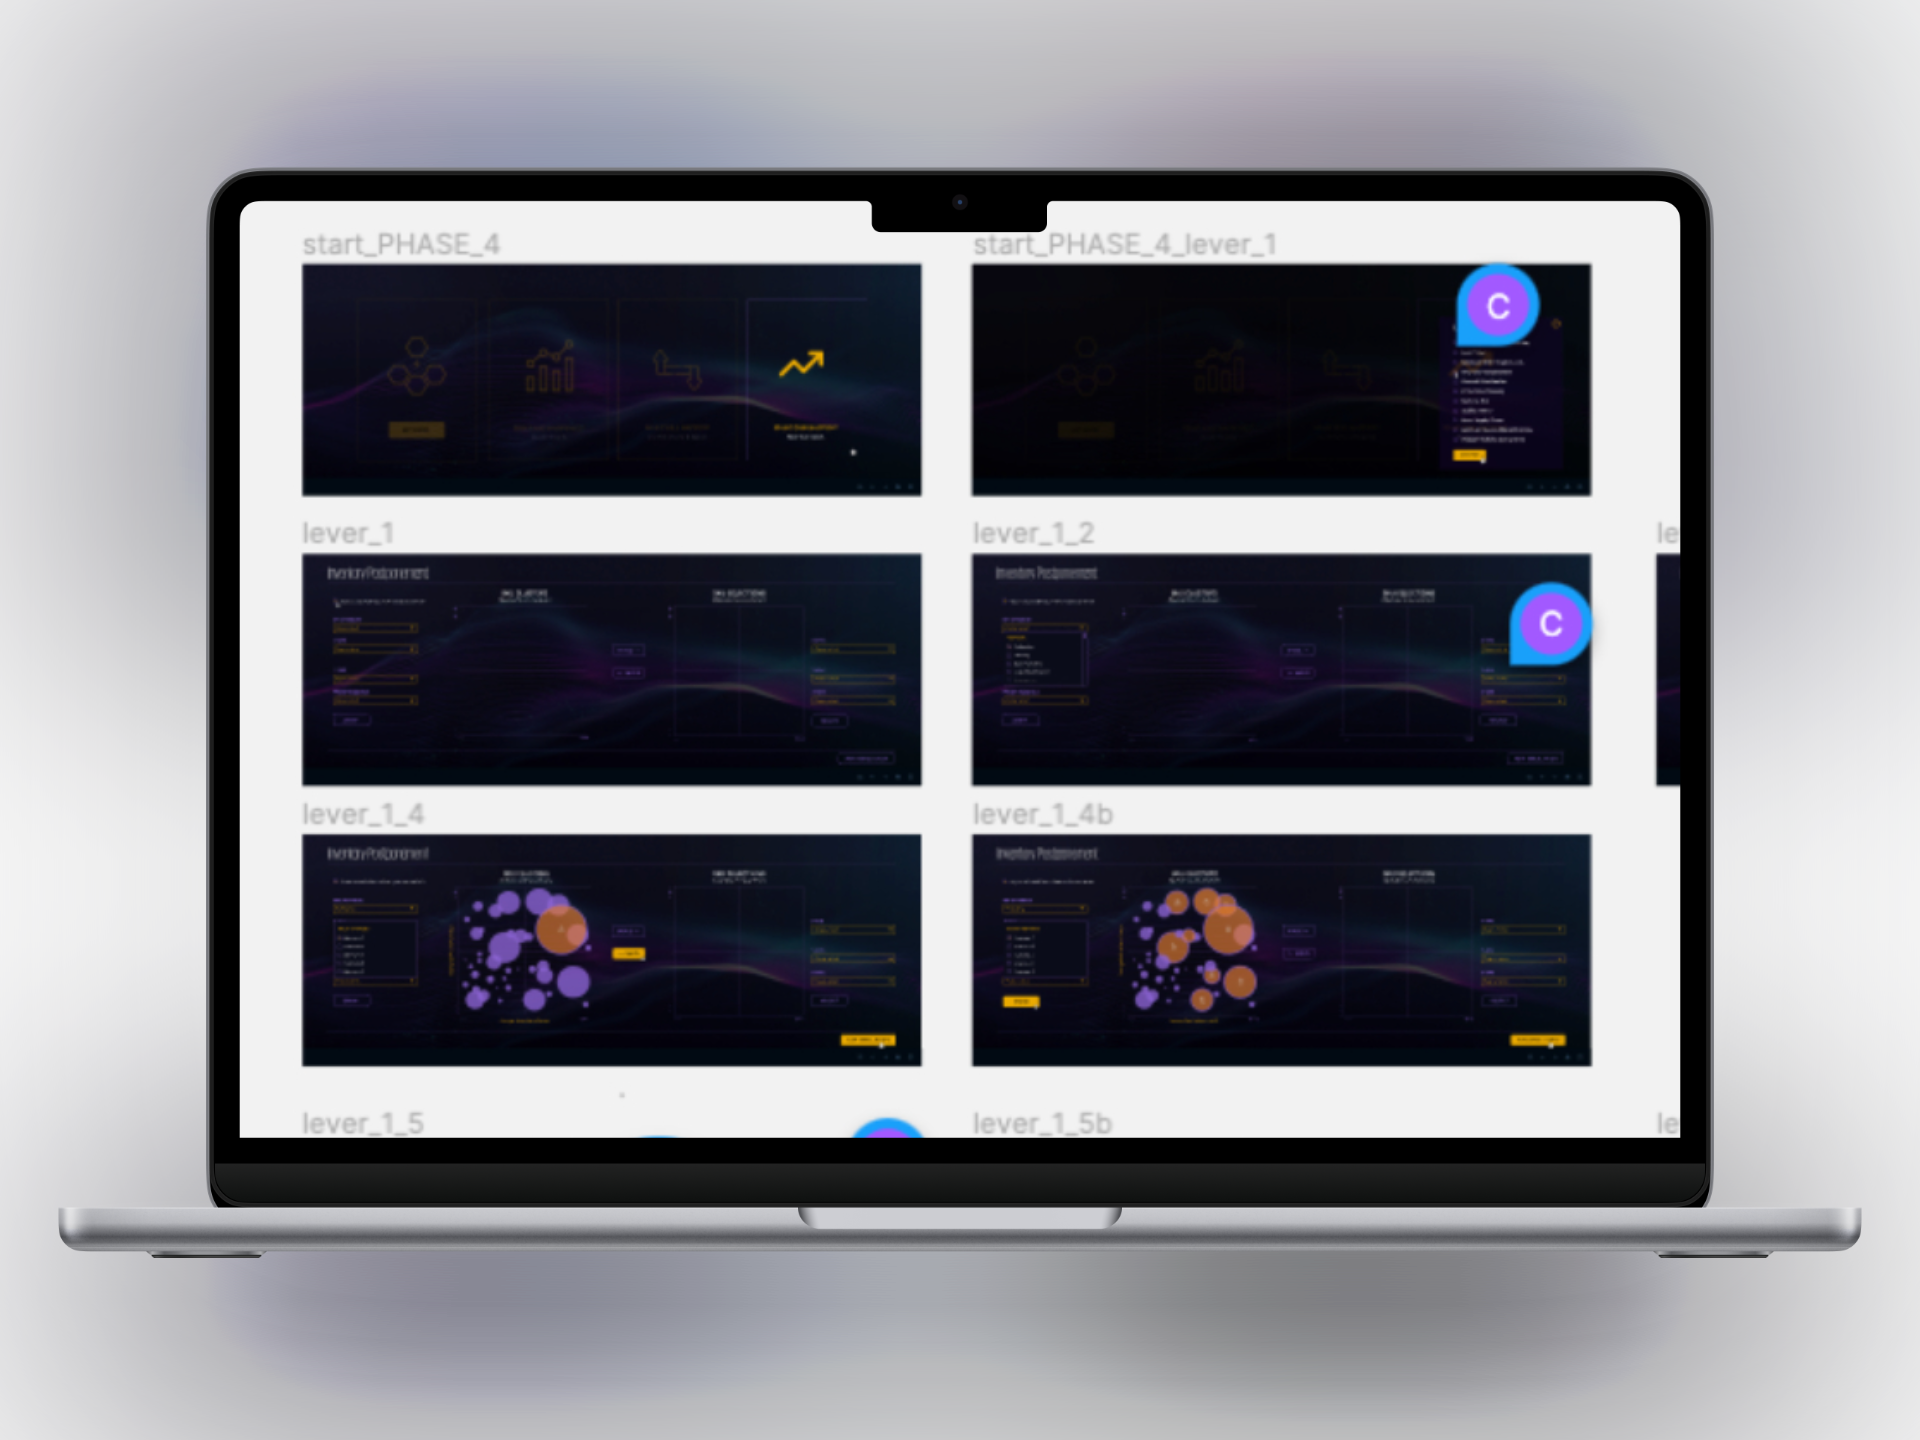
Interface design
Once the user flow is approved, I start moving pixels.
Leveraging a design system I created (ICE), I use various components to design beautiful and functional screens.
I leverage Figma to collaborate with stakeholders for feedback, reviews, and presentations.
Human-centered design
Human-centered design
Human-centered design (HCD) is an iterative design approach that focuses on understanding the needs, behaviors, and desires of the people who will use the product or service being developed.